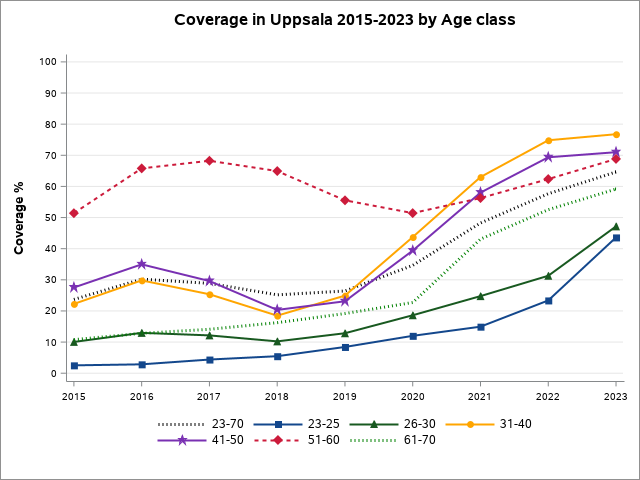
| Coverage in Uppsala | ||||||||
| Age class | ||||||||
|---|---|---|---|---|---|---|---|---|
| County | Year | 23-70 | 23-25 | 26-30 | 31-40 | 41-50 | 51-60 | 61-70 |
| 03 | 2014 | 63.9 | 65.1 | 62.5 | 72.5 | 72.2 | 79.6 | 29.4 |
| 03 | 2015 | 65.5 | 78.6 | 67.3 | 74.7 | 73.8 | 79.0 | 26.5 |
| 03 | 2016 | 67.7 | 84.3 | 70.7 | 77.7 | 76.0 | 81.5 | 24.9 |
| 03 | 2017 | 68.0 | 89.9 | 73.2 | 76.8 | 74.5 | 81.3 | 24.5 |
| 03 | 2018 | 68.0 | 87.5 | 76.7 | 76.8 | 72.8 | 80.1 | 26.1 |
| 03 | 2019 | 67.7 | 86.4 | 78.5 | 76.8 | 71.2 | 75.1 | 29.7 |
| 03 | 2020 | 68.0 | 89.6 | 78.1 | 76.9 | 71.6 | 70.9 | 32.7 |
| 03 | 2021 | 72.1 | 88.0 | 80.9 | 77.9 | 72.1 | 72.1 | 51.1 |
| 03 | 2022 | 72.7 | 87.0 | 80.4 | 76.2 | 70.9 | 72.6 | 58.3 |
| Coverages for 2014 and later are calculated against women's national registration and can vary for individual counties by 1 percentage point, |
| compared with the previous calculation method which used the sampler's county affiliation. |
| Updated 24MAR2023 17:40:48 |